
Automobile Accident Deaths: The Annual Numbers

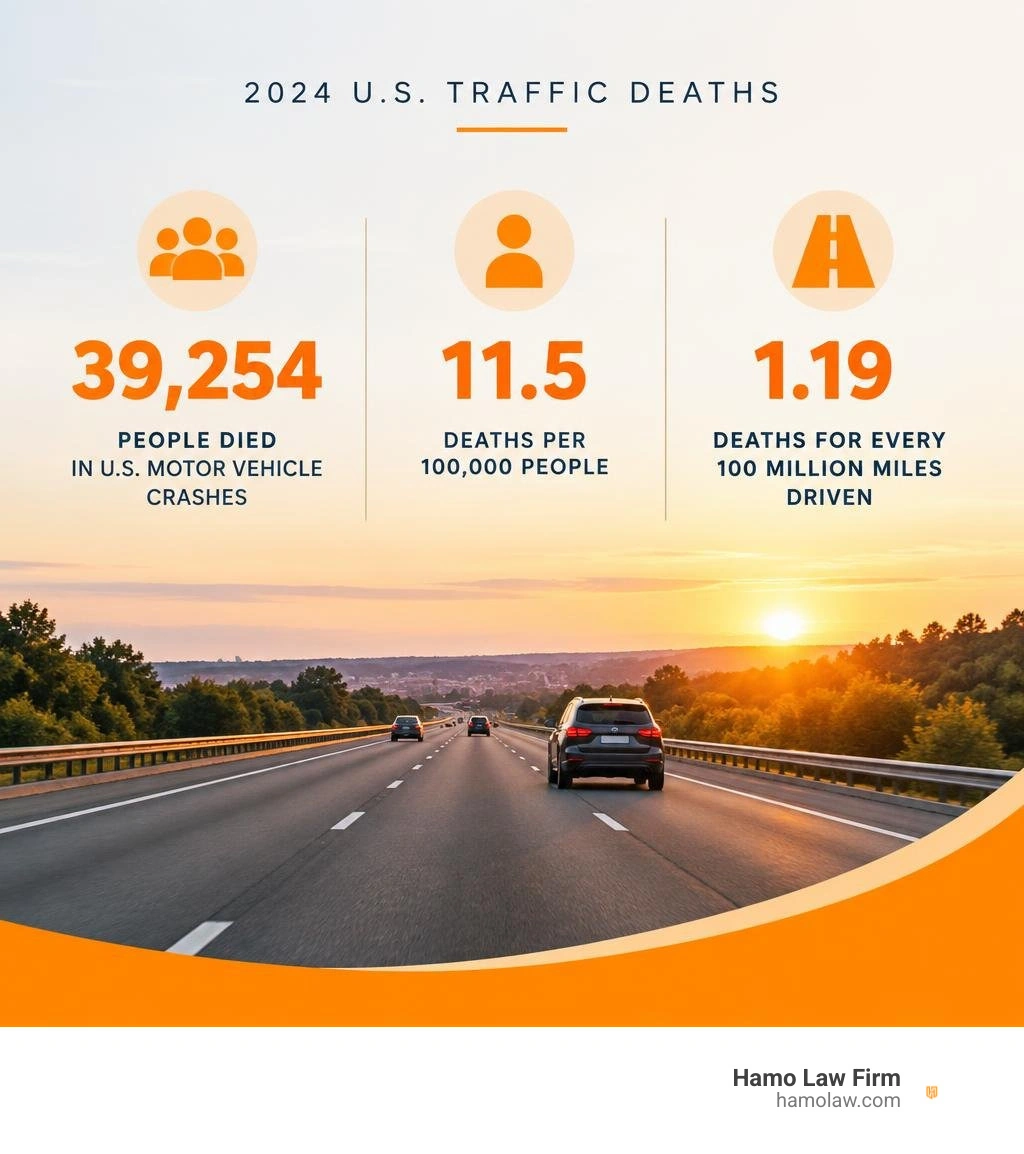
In 2024, 39,254 people died in U.S. motor vehicle crashes. That is 11.5 deaths per 100,000 people, or 1.19 deaths for every 100 million miles driven. These rates help show how the risk is changing, even as the number of drivers and miles traveled changes.
Behind each number is a person and a family. This article breaks down the annual totals, long-term trends, and risks that matter to Michigan residents. I'm George Hamo, and I'll help you make sense of the data on deaths in automobile accidents.
Automobile accidents deaths terms you need:
- automobile accidents
- local automobile accidents
U.S. Automobile Accidents Deaths: Historical Trends and Current Data
To understand where road safety stands today, we have to look back at the historical milestones that shaped our transportation network. According to Table 2-17: Motor Vehicle Safety Data | Bureau of Transportation Statistics, traffic safety has evolved through distinct eras of vehicle manufacturing, highway design, and public policy.
In 1913, when motorized travel was still in its infancy, only 4,200 fatalities were recorded nationwide across roughly 1.3 million registered vehicles. As mass production made cars widely accessible, traffic fatalities climbed steadily. By 1937, the population fatality rate reached a historic peak of 30.8 deaths per 100,000 people. Total annual deaths continued upward through the mid-20th century, reaching an absolute summit in the early 1970s when annual fatalities exceeded 54,000.
Historical records published in Motor Vehicle Accidents - Number and Deaths demonstrate how structural safety improvements began reversing these numbers. Over the next four decades, safety legislation, vehicle crashworthiness standards, and roadway engineering caused fatality rates to decline substantially, reaching a modern low of 32,479 total deaths in 2011.
| Metric / Benchmark Year | 1913 | 1937 | 1970 | 2011 | 2024 | Overall Change |
|---|---|---|---|---|---|---|
| Total Fatalities | 4,200 | 39,643 | 52,627 | 32,479 | 39,254 | +835% (since 1913) |
| Registered Vehicles | 1.3 Million | 30.0 Million | 111.2 Million | 253.6 Million | 297.5 Million | +22,785% |
| Fatality Rate (Per 10k Vehicles) | 33.38 | 13.21 | 4.73 | 1.28 | 1.32 | -96.0% |
| Fatality Rate (Per 100M VMT) | ~30.0+ | 15.90 | 4.74 | 1.10 | 1.19 | -96.0% |
| Population Rate (Per 100k People) | 4.3 | 30.8 | 25.7 | 10.4 | 11.5 | -62.7% (vs 1937 peak) |
Century-Long Safety Metrics: Per Capita, Registered Vehicles, and VMT
Raw fatality numbers do not reveal the entire picture because driving exposure has expanded exponentially. In 1913, the United States saw 33.38 deaths per 10,000 registered motor vehicles. By 2024, that metric dropped by 96% to roughly 1.32 per 10,000 vehicles. Similarly, mileage death rates dropped from over 18.65 deaths per 100 million vehicle miles traveled (VMT) in the 1920s to approximately 1.19 in 2024.
Federal agencies like the National Highway Traffic Safety Administration (NHTSA) track these metrics through the Fatality Analysis Reporting System (FARS), applying the standard 30-day definition—counting any individual who succumbs to crash-related injuries within 30 days of the incident. When families face these tragedies, obtaining skilled representation after injuries from car accidents is essential to uncover what happened and hold negligent motorists accountable.
Post-Pandemic Reversals and Modern Risky Driving Patterns
Despite over a century of broad safety gains, the last several years have exhibited a concerning reversal. Between 2019 and 2024, the vehicle death rate increased by 2.1%, the mileage death rate rose by 8.3%, and the population death rate climbed by 5.9%.
During the COVID-19 pandemic, open highways encouraged severe speeding and reckless behavior. Even as traffic volumes normalized, these dangerous habits persisted. Elevated rates of distracted driving, excessive speeding, and driver impairment continue to challenge highway safety across metropolitan corridors and rural routes alike.
State-by-State Breakdown: Fatal Crash Rates and Behavioral Risk Factors
Geographic location plays a major role in traffic safety outcomes. The comprehensive dataset in Fatality Facts 2024: State by state highlights wide variations across jurisdictions driven by roadway engineering, population density, speed regulations, and local driving habits.
| State | Fatalities (2024) | Population Rate (Per 100k) | Mileage Rate (Per 100M VMT) | Single-Vehicle Share | Speeding-Related Share |
|---|---|---|---|---|---|
| Mississippi (Highest Population Rate) | 752 | 25.6 | 1.81 | 59% | 24% |
| Rhode Island (Lowest Population Rate) | 52 | 4.7 | 0.65 | 50% | 38% |
| Massachusetts (Lowest Urban Rate) | 398 | 5.7 | 0.63 | 55% | 31% |
| North Dakota (Highest Rural Share) | 98 | 12.5 | 1.05 | 68% | 27% |
| Michigan | 1,098 | 10.8 | 1.10 | 49% | 26% |
Regional Disparities: Per-Capita Rankings and Rural vs. Urban Road Fatality Rates
In 2024, Mississippi recorded the nation's highest per-capita motor vehicle death rate at 25.6 per 100,000 residents, alongside a mileage rate of 1.81 deaths per 100 million VMT. Conversely, Rhode Island logged the lowest per-capita rate at 4.7 per 100,000 residents.
Land use differences explain much of this disparity. Nationally, 41% of fatal crashes occur on rural roads, but in states like North Dakota, rural highways account for 81% of all traffic deaths. In contrast, Massachusetts records only 8% of its fatalities in rural environments. Rural corridors typically feature higher posted speed limits, two-lane undivided roadways, unlit segments, and extended emergency medical service (EMS) transit times. For local families coping with devastating collisions across Wayne County, Genesee County, or greater Detroit and Flint, navigating legal rights after a fatal car accident in Michigan ensures that critical evidence is preserved and statutory claims are protected.
Critical Behavioral Factors: Restraint Non-Use, Speeding, and Impaired Driving
Three core driver behaviors continue to drive fatal collision statistics across the country:
- Restraint Non-Use: While nationwide observed seatbelt use among front-seat occupants reached 91% in 2024, 43% of fatally injured passenger vehicle occupants were unrestrained. In some jurisdictions, fewer than 30% of fatally injured occupants were buckled up.
- Excessive Speeding: Speeding was a contributing factor in 29% of all motor vehicle fatalities nationwide in 2024. In states like Vermont and Alaska, speeding contributed to 54% and 50% of fatal crashes, respectively.
- Alcohol and Substance Impairment: Nationally, alcohol involvement accounts for roughly 31% of crash deaths. Estimated driver blood alcohol concentration (BAC) levels of 0.08% or higher ranged from 23% in states like Minnesota and Kentucky to 49% in Hawaii.
Road User Dynamics and Demographic Risk Profiles

Crash risks and fatal outcomes are not distributed evenly across road users or demographics. Understanding who is most vulnerable helps target both safety initiatives and legal investigations.
Demographic Disparities in Automobile Accidents Deaths
Road traffic injuries represent the leading cause of death worldwide for children and young adults aged 5 to 29 years. In the United States, motor vehicle crashes are the leading cause of preventable death for individuals aged 5 to 22.
- Gender Disparities: Males are approximately three times more likely to die in road traffic crashes than females, driven largely by higher rates of speeding, alcohol impairment, and lower restraint compliance.
- Socioeconomic Factors: Lower-income individuals often face higher risk due to older passenger vehicles with fewer active safety features, as well as limited pedestrian infrastructure in their neighborhoods.
When a fatal collision claims a loved one, surviving family members often require clear guidance on who can file a wrongful death claim under state probate statutes.
Vulnerable Road Users and Crash Types: Single-Vehicle vs. Multi-Vehicle Collisions
In 2024, 52% of all motor vehicle crash fatalities in the U.S. occurred in single-vehicle crashes, such as roadway departures, rollover incidents, and fixed-object impacts with trees, guardrails, or bridge abutments. The remaining 48% involved multi-vehicle collisions at intersections or on crowded highways.
Recent Michigan news underscores these hazards across our local communities. For example, a severe collision was documented when 1 dead after three-vehicle crash on I-96 Tuesday in Wayne County, police said, demonstrating how rapidly multi-car pileups can turn fatal. Similarly, vulnerable road users such as motorcyclists and pedestrians face extreme physical vulnerability when sharing lanes with passenger trucks and SUVs, as reported when One dead after SUV collides with motorcycle in Genesee County near Flint.
Global Road Safety and International Comparisons
Motor vehicle mortality is a pressing global public health crisis that reveals stark differences in infrastructure, public transit adoption, and traffic enforcement worldwide.
Global Impact and Deaths in Automobile Accidents Worldwide
According to the World Health Organization (WHO), approximately 1.16 million people die annually in road traffic crashes worldwide. Low- and middle-income countries bear a disproportionate burden, suffering roughly 92% of all global traffic fatalities despite possessing only 60% of the world's registered vehicles.
Physics explains much of the global trauma: every 1% increase in mean travel speed produces a 4% increase in fatal crash risk and a 3% increase in serious crash risk. The Safe System approach seeks to build human-tolerant road environments, recognizing that while human error is inevitable, fatal injuries are preventable through forgiving infrastructure, side-impact barriers, and rapid pre-hospital emergency trauma care.
Comparing U.S. Fatality Rates with Japan, Germany, and South Korea
When compared to other developed economies, the United States reports substantially higher per-capita road fatality rates.
- Japan: Official government data from 令和7年中の交通事故死者数について|警察庁Webサイト reveals that Japan recorded 2,547 traffic fatalities in 2025—the lowest figure since records began in 1948, reflecting a 4.4% year-over-year decline. Japan's per-capita rate sits at roughly 2.0 deaths per 100,000 residents, driven by widespread passenger rail networks, compact urban design, and rigorous vehicle inspection laws.
- Germany: Data published by Accidents registered by the police: specification - German Federal Statistical Office shows that Germany registered 2,832 road fatalities in 2025 (compared to 2,770 in 2024 and 2,839 in 2023). Germany maintains a per-capita rate of approximately 3.4 deaths per 100,000 people due to strict driver licensing standards and robust vehicle engineering.
- South Korea: Through the national traffic database at TAAS 교통사고분석시스템, South Korea reported 193,889 traffic collisions resulting in 2,549 deaths and 271,751 injuries nationwide in 2025, reflecting intensive urban traffic management and pedestrian protection initiatives.
In contrast, the U.S. per-capita rate of 11.5 per 100,000 people is roughly three to five times higher than that of these developed peers, largely due to high vehicle dependency, higher highway speed limits, and greater pickup truck and SUV market shares.
Proven Interventions, Economic Toll, and the Safe System Approach
Road traffic crashes place an enormous economic drain on families and national economies alike, costing most developed nations between 1% and 3% of their annual gross domestic product (GDP).
Economic Loss and Societal Cost of Motor Vehicle Collisions
The societal cost of motor vehicle fatalities encompasses direct emergency medical expenses, vehicle damage, incident management costs, lost wages, and lost future productivity. For grieving families, the financial shock often arrives alongside profound emotional trauma.
When an unexpected tragedy occurs due to distracted driving or commercial trucking negligence, seeking damages through wrongful death claims allows estates to recover medical bills, funeral expenses, and loss of financial support. Because strict statutes of limitation apply, knowing the deadlines to file a wrongful death claim in Michigan is critical to preserving your right to financial recovery.
Evidence-Based Safety Interventions and the UN 2030 Agenda
The United Nations has set a target within the Decade of Action for Road Safety to reduce road traffic deaths and injuries by 50% by 2030. Proven interventions include:
- Primary Seatbelt Enforcement: Mandatory primary seatbelt laws reduce front-seat occupant fatality risks by up to 50%.
- Universal Motorcycle Helmet Laws: Helmet use reduces motorcycle fatality risk by more than six times and cuts traumatic brain injuries by up to 74%.
- Active Vehicle Technologies: Federal mandates requiring Electronic Stability Control (ESC) and Automatic Emergency Braking (AEB) prevent roadway departure and front-to-rear collisions.
- Automated Speed and Intersection Enforcement: Speed-safety cameras and modernized roundabout intersections reduce angle and broadside collisions by over 70%.
Frequently Asked Questions About Fatal Motor Vehicle Crashes
Which U.S. state experiences the highest motor vehicle death rate?
Mississippi consistently logs the highest per-capita motor vehicle death rate in the nation, recording 25.6 fatalities per 100,000 residents in 2024 and a mileage rate of 1.81 deaths per 100 million VMT. This is driven by high proportions of rural travel, undivided highways, and lower restraint compliance.
What is the most common contributing factor in fatal single-vehicle crashes?
Roadway departures are the leading cause of fatal single-vehicle crashes, accounting for over half of all single-vehicle fatalities. Key contributing factors include excessive vehicle speed, alcohol or drug impairment, distracted driving, and non-use of seatbelts during rollover events.
How do U.S. traffic fatalities compare to nations like Japan and Germany?
The United States experiences significantly higher per-capita fatality rates (11.5 per 100,000) than Japan (approx. 2.0 per 100,000) and Germany (approx. 3.4 per 100,000). These nations benefit from greater reliance on passenger rail systems, stricter driver licensing examinations, and widespread pedestrian-oriented urban road designs.
Conclusion
Understanding motor vehicle fatality trends reveals that roadway safety is not accidental—it requires strong enforcement, modern vehicle technology, and responsible driving habits. While nationwide fatality rates have improved by over 90% since the early 20th century, thousands of preventable deaths continue to occur annually across Michigan and the United States.
At Hamo Law Firm, we bring over 40 years of trial experience to the table, standing up to aggressive insurance companies on behalf of injured victims and grieving families across Flint, Detroit, Wayne County, and Genesee County. We operate strictly on a contingency-fee model, which means there are never any upfront fees unless we secure a winning recovery for you.
If your family is navigating the aftermath of a fatal collision, reach out to our team today for dedicated legal advocacy for automobile, truck, and motorcycle accidents.